The Cy Young Award is given to the two best pitchers in Major League Baseball since 1967, but before that year the award was given only to the best overall pitcher in the MLB. Few pitchers have had the joy of winning the Cy Young Award twice in a row.
The first Cy Young winner was Don Newcombe of the Brooklyn Dodgers with a record of 27 wins and only 7 losses and a 3.06 ERA. Newcombe also played in the Negro League with the Newark Eagles before joining Major League Baseball in 1949.
The Dodgers, Brooklyn or Los Angeles, are the most dominant team in the Cy Young Award as they have the most pitchers who were awarded the Cy Young title with a total of 12 awards, no other team is close to double digits.
Why is it called Cy Young Award?
The award is named after one of the greatest pitchers in the history of baseball in the United States, Denton True “Cy” Young. He played for the Cleveland Spiders, St. Louis Perfectos, Boston Americans, and Boston Rustlers.
Who is the player with the most Cy Young Awards?
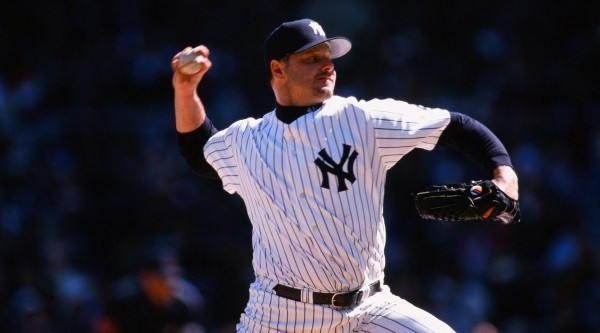
Roger Clemens is the MLB player with a record seven Cy Young Awards (1986, 1987, 1991, 1997, 1998, 2001, 2004). The other player with a large number of awards is Randy Johnson with 5 awards and third on the list are Steve Carlton and Greg Maddux with 4 each.
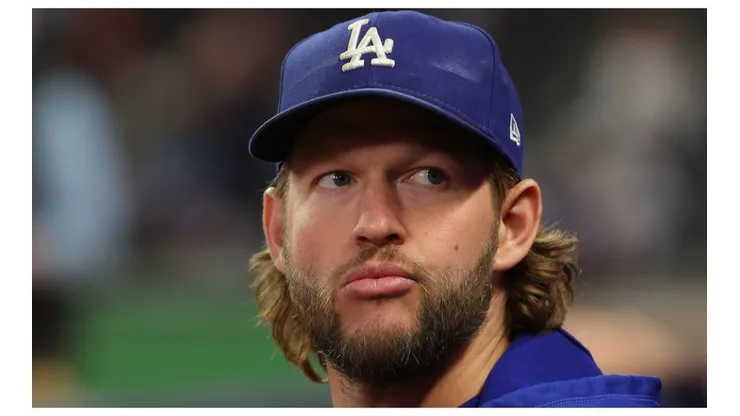
Only two active players, Max Scherzer and Clayton Kershaw, are relatively close to Clemens’ record with three Cy Young Awards each. Most of the other players on the list are either retired or way off Clemens’ record.
Who has won the Cy Young Award in a row?
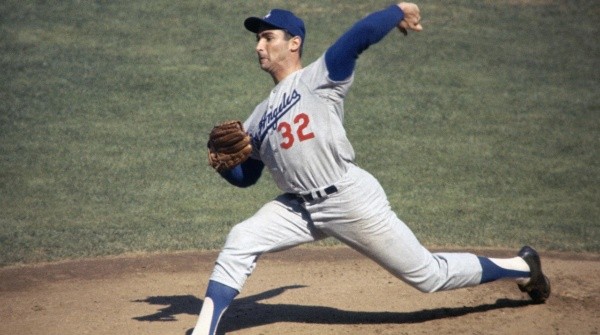
Sandy Koufax was the first to establish that record by winning two consecutive Cy Young Awards in 1965 and 1966. The second to win the award twice in a row was Jim Palmer (1975 and 1976), other players who did the same was Roger Clemens (first double 1986, 1987, second double 1997, 1998), Pedro Martinez ( 1999 and 2000), Lincecum (2008, 2009), Kershaw (2013, 2014), Scherzer (2016, 2017) and deGrom (2018, 2019).
Other players set literally unbreakable Cy Young Award records by winning the award three or more times in a row: Greg Maddux (1992, 1993, 1994, 1995) and Randy Johnson (1999, 2000, 2001, 2002).
ListofCy Young Award winners in the American League
| Year | Pitcher | Team | Record | Saves | ERA | K’s |
|---|---|---|---|---|---|---|
| 1967 | Jim Lonborg | Boston Red Sox | 22–9 | 0 | 3.16 | 246 |
| 1968 | Denny McLain | Detroit Tigers | 31–6 | 0 | 1.96 | 280 |
| 1969 | Mike Cuellar | Baltimore Orioles | 23–11 | 0 | 2.38 | 182 |
| 1969 | Denny McLain | Detroit Tigers | 24–9 | 0 | 2.80 | 181 |
| 1970 | Jim Perry | Minnesota Twins | 24–12 | 0 | 3.04 | 168 |
| 1971 | Vida Blue | Oakland Athletics | 24–8 | 0 | 1.82 | 301 |
| 1972 | Gaylord Perry | Cleveland Indians | 24–16 | 1 | 1.92 | 234 |
| 1973 | Jim Palmer | Baltimore Orioles | 22–9 | 1 | 2.40 | 168 |
| 1974 | Catfish Hunter | Oakland Athletics | 25–12 | 0 | 2.49 | 143 |
| 1975 | Jim Palmer | Baltimore Orioles | 23–11 | 1 | 2.09 | 193 |
| 1976 | Jim Palmer | Baltimore Orioles | 22–13 | 0 | 2.51 | 159 |
| 1977 | Sparky Lyle | New York Yankees | 13–5 | 26 | 2.17 | 68 |
| 1978 | Ron Guidry | New York Yankees | 25–3 | 0 | 1.74 | 248 |
| 1979 | Mike Flanagan | Baltimore Orioles | 23–9 | 0 | 3.08 | 190 |
| 1980 | Steve Stone | Baltimore Orioles | 25–7 | 0 | 3.23 | 149 |
| 1981 | Rollie Fingers | Milwaukee Brewers | 6–3 | 28 | 1.04 | 61 |
| 1982 | Pete Vuckovich | Milwaukee Brewers | 18–6 | 0 | 3.34 | 105 |
| 1983 | LaMarr Hoyt | Chicago White Sox | 24–10 | 0 | 3.66 | 148 |
| 1984 | Willie Hernández | Detroit Tigers | 9–3 | 32 | 1.92 | 112 |
| 1985 | Bret Saberhagen | Kansas City Royals | 20–6 | 0 | 2.87 | 158 |
| 1986 | Roger Clemens | Boston Red Sox | 24–4 | 0 | 2.48 | 238 |
| 1987 | Roger Clemens | Boston Red Sox | 20–9 | 0 | 2.97 | 256 |
| 1988 | Frank Viola | Minnesota Twins | 24–7 | 0 | 2.64 | 193 |
| 1989 | Bret Saberhagen | Kansas City Royals | 23–6 | 0 | 2.16 | 193 |
| 1990 | Bob Welch | Oakland Athletics | 27–6 | 0 | 2.95 | 127 |
| 1991 | Roger Clemens | Boston Red Sox | 18–10 | 0 | 2.62 | 241 |
| 1992 | Dennis Eckersley | Oakland Athletics | 7–1 | 51 | 1.91 | 93 |
| 1993 | Jack McDowell | Chicago White Sox | 22–10 | 0 | 3.37 | 158 |
| 1994 | David Cone | Kansas City Royals | 16–5 | 0 | 2.94 | 132 |
| 1995 | Randy Johnson | Seattle Mariners | 18–2 | 0 | 2.48 | 294 |
| 1996 | Pat Hentgen | Toronto Blue Jays | 20–10 | 0 | 3.22 | 177 |
| 1997 | Roger Clemens | Toronto Blue Jays | 21–7 | 0 | 2.05 | 292 |
| 1998 | Roger Clemens | Toronto Blue Jays | 20–6 | 0 | 2.65 | 271 |
| 1999 | Pedro Martínez | Boston Red Sox | 23–4 | 0 | 2.07 | 313 |
| 2000 | Pedro Martínez | Boston Red Sox | 18–6 | 0 | 1.74 | 284 |
| 2001 | Roger Clemens | New York Yankees | 20–3 | 0 | 3.51 | 213 |
| 2002 | Barry Zito | Oakland Athletics | 23–5 | 0 | 2.75 | 182 |
| 2003 | Roy Halladay | Toronto Blue Jays | 22–7 | 0 | 3.25 | 204 |
| 2004 | Johan Santana | Minnesota Twins | 20–6 | 0 | 2.61 | 265 |
| 2005 | Bartolo Colón | Los Angeles Angels | 21–8 | 0 | 3.48 | 157 |
| 2006 | Johan Santana | Minnesota Twins | 19–6 | 0 | 2.77 | 265 |
| 2007 | CC Sabathia | Cleveland Indians | 19–7 | 0 | 3.21 | 209 |
| 2008 | Cliff Lee | Cleveland Indians | 22–3 | 0 | 2.54 | 170 |
| 2009 | Zack Greinke | Kansas City Royals | 16–8 | 0 | 2.16 | 242 |
| 2010 | Félix Hernández | Seattle Mariners | 13–12 | 0 | 2.27 | 232 |
| 2011 | Justin Verlander | Detroit Tigers | 24–5 | 0 | 2.40 | 250 |
| 2012 | David Price | Tampa Bay Rays | 20–5 | 0 | 2.56 | 205 |
| 2013 | Max Scherzer | Detroit Tigers | 21–3 | 0 | 2.90 | 240 |
| 2014 | Corey Kluber | Cleveland Indians | 18–9 | 0 | 2.44 | 269 |
| 2015 | Dallas Keuchel | Houston Astros | 20–8 | 0 | 2.48 | 216 |
| 2016 | Rick Porcello | Boston Red Sox | 22–4 | 0 | 3.15 | 189 |
| 2017 | Corey Kluber | Cleveland Indians | 18–4 | 0 | 2.25 | 265 |
| 2018 | Blake Snell | Tampa Bay Rays | 21–5 | 0 | 1.89 | 221 |
| 2019 | Justin Verlander | Houston Astros | 21–6 | 0 | 2.58 | 300 |
| 2020 | Shane Bieber | Cleveland Indians | 8–1 | 0 | 1.63 | 122 |
| 2021 | Robbie Ray | Toronto Blue Jays | 13–7 | 0 | 2.84 | 248 |
| 2022 | ? | ? |
ListofCy Young Award winners in the National League
| Year | Pitcher | Team | Record | Saves | ERA | K’s |
|---|---|---|---|---|---|---|
| 1967 | Mike McCormick | San Francisco Giants | 22–10 | 0 | 2.85 | 150 |
| 1968 | Bob Gibson | St. Louis Cardinals | 22–9 | 0 | 1.12 | 268 |
| 1969 | Tom Seaver | New York Mets | 25–7 | 0 | 2.21 | 208 |
| 1970 | Bob Gibson | St. Louis Cardinals | 23–7 | 0 | 3.12 | 274 |
| 1971 | Ferguson Jenkins | Chicago Cubs | 24–13 | 0 | 2.77 | 263 |
| 1972 | Steve Carlton | Philadelphia Phillies | 27–10 | 0 | 1.98 | 310 |
| 1973 | Tom Seaver | New York Mets | 19–10 | 0 | 2.08 | 251 |
| 1974 | Mike Marshall | Los Angeles Dodgers | 15–12 | 21 | 2.42 | 143 |
| 1975 | Tom Seaver | New York Mets | 22–9 | 0 | 2.38 | 243 |
| 1976 | Randy Jones | San Diego Padres | 22–14 | 0 | 2.74 | 93 |
| 1977 | Steve Carlton | Philadelphia Phillies | 23–10 | 0 | 2.64 | 198 |
| 1978 | Gaylord Perry | San Diego Padres | 21–6 | 0 | 2.73 | 154 |
| 1979 | Bruce Sutter | Chicago Cubs | 6–6 | 37 | 2.22 | 110 |
| 1980 | Steve Carlton | Philadelphia Phillies | 24–9 | 0 | 2.34 | 286 |
| 1981 | Fernando Valenzuela | Los Angeles Dodgers | 13–7 | 0 | 2.48 | 180 |
| 1982 | Steve Carlton | Philadelphia Phillies | 23–11 | 0 | 3.11 | 286 |
| 1983 | John Denny | Philadelphia Phillies | 19–6 | 0 | 2.37 | 139 |
| 1984 | Rick Sutcliffe | Chicago Cubs | 16–1 | 0 | 2.69 | 155 |
| 1985 | Dwight Gooden | New York Mets | 24–4 | 0 | 1.53 | 268 |
| 1986 | Mike Scott | Houston Astros | 18–10 | 0 | 2.22 | 306 |
| 1987 | Steve Bedrosian | Philadelphia Phillies | 5–3 | 40 | 2.83 | 74 |
| 1988 | Orel Hershiser | Los Angeles Dodgers | 23–8 | 1 | 2.26 | 178 |
| 1989 | Mark Davis | San Diego Padres | 4–3 | 44 | 1.85 | 92 |
| 1990 | Doug Drabek | Pittsburgh Pirates | 22–6 | 0 | 2.76 | 131 |
| 1991 | Tom Glavine | Atlanta Braves | 20–11 | 0 | 2.55 | 192 |
| 1992 | Greg Maddux | Chicago Cubs | 20–11 | 0 | 2.18 | 199 |
| 1993 | Greg Maddux | Atlanta Braves | 20–10 | 0 | 2.36 | 197 |
| 1994 | Greg Maddux | Atlanta Braves | 16–6 | 0 | 1.56 | 156 |
| 1995 | Greg Maddux | Atlanta Braves | 19–2 | 0 | 1.63 | 181 |
| 1996 | John Smoltz | Atlanta Braves | 24–8 | 0 | 2.94 | 276 |
| 1997 | Pedro Martínez | Montreal Expos | 17–8 | 0 | 1.90 | 305 |
| 1998 | Tom Glavine | Atlanta Braves | 20–6 | 0 | 2.47 | 157 |
| 1999 | Randy Johnson | Arizona Diamondbacks | 17–9 | 0 | 2.49 | 364 |
| 2000 | Randy Johnson | Arizona Diamondbacks | 19–7 | 0 | 2.64 | 347 |
| 2001 | Randy Johnson | Arizona Diamondbacks | 21–6 | 0 | 2.49 | 372 |
| 2002 | Randy Johnson | Arizona Diamondbacks | 24–5 | 0 | 2.32 | 334 |
| 2003 | Éric Gagné | Los Angeles Dodgers | 2–3 | 55 | 1.20 | 137 |
| 2004 | Roger Clemens | Houston Astros | 18–4 | 0 | 2.98 | 218 |
| 2005 | Chris Carpenter | St. Louis Cardinals | 21–5 | 0 | 2.83 | 213 |
| 2006 | Brandon Webb | Arizona Diamondbacks | 16–8 | 0 | 3.10 | 178 |
| 2007 | Jake Peavy | San Diego Padres | 19–6 | 0 | 2.54 | 240 |
| 2008 | Tim Lincecum | San Francisco Giants | 18–5 | 0 | 2.62 | 265 |
| 2009 | Tim Lincecum | San Francisco Giants | 15–7 | 0 | 2.48 | 261 |
| 2010 | Roy Halladay | Philadelphia Phillies | 21–10 | 0 | 2.44 | 219 |
| 2011 | Clayton Kershaw | Los Angeles Dodgers | 21–5 | 0 | 2.28 | 248 |
| 2012 | R. A. Dickey | New York Mets | 20–6 | 0 | 2.73 | 230 |
| 2013 | Clayton Kershaw | Los Angeles Dodgers | 16–9 | 0 | 1.83 | 232 |
| 2014 | Clayton Kershaw | Los Angeles Dodgers | 21–3 | 0 | 1.77 | 239 |
| 2015 | Jake Arrieta | Chicago Cubs | 22–6 | 0 | 1.77 | 236 |
| 2016 | Max Scherzer | Washington Nationals | 20–7 | 0 | 2.96 | 284 |
| 2017 | Max Scherzer | Washington Nationals | 16–6 | 0 | 2.51 | 268 |
| 2018 | Jacob deGrom | New York Mets | 10–9 | 0 | 1.70 | 269 |
| 2019 | Jacob deGrom | New York Mets | 11–8 | 0 | 2.43 | 255 |
| 2020 | Trevor Bauer | Cincinnati Reds | 5–4 | 0 | 1.73 | 100 |
| 2021 | Corbin Burnes | Milwaukee Brewers | 11–5 | 0 | 2.43 | 234 |
| 2022 | ? | ? |